Diva-Fit: A step-by-step manual for generating high-resolution graphs and histogram overlays of flow cytometry data obtained with FACSDiva software
Kristoffer Weber, Boris Fehse
Research Dept. Cell and Gene Therapy, Clinic for Stem Cell Transplantation, UCCH, University Medical Centre Hamburg-Eppendorf, Germany
Correspondence:
Research Dept. Cell and Gene Therapy, Clinic for Stem Cell Transplantation, UCCH, University Medical Centre Hamburg-Eppendorf, Martinistr. 52, 20246 Hamburg, Germany
Phone: +49-40-7410-52705 / +49-40-7410-55518
E-mail: k.weber@uke.de or fehse@uke.de
Accepted 03 July 2009
Published 04 August 2009
Summary
In recent years, flow cytometry has been revolutionized via the introduction of digital data acquisition and analysis tools that facilitate simultaneous investigation of ten or more parameters. At the same time, some data presentation tools offered by commercial suppliers have remained surprisingly “antiquated”. This leads to the ironic fact that high-quality data is often represented by poor-quality illustrations: namely pixelated plots. In particular, data obtained using FACSDiva software is frequently exported into figures as low-resolution pixel graphics resulting in low-quality images. Additionally, even the newest version, Diva_6.1.2, is still unable to generate histogram overlays, a popular and convincing tool for direct data comparison. We hereby present an easy and down-to-earth Diva-Figure-improvement toolbox (Diva-Fit), which facilitates the generation of high-resolution graphs based on data acquired with FACSDiva software. Moreover, Diva-Fit allows the easy removal of unwanted quadrant labels without impairing the quality of FACS plots. Finally, we show that Diva-Fit supports straightforward composition of histogram overlays. All software tools necessary are freely available. We believe that the proposed toolbox may be very useful for many researchers working with flow cytometry.
Keywords
Flow cytometry, data analysis, graphical display, high-resolution facs plots, histogram overlay, free software
Supplementary material
Introduction
Flow cytometry (FCM), often referred to as Fluorescence Activated Cell Sorting (FACS) has developed into a highly sophisticated cell analysis method, which facilitates the concurrent analysis of multiple cell parameters [1]. At the same time and most surprisingly, graphical presentation of FCM data is often characterized by low-quality images.
In particular, FACSDiva software has two major drawbacks: First, even the latest version does not support generation of histogram overlays. Since histogram overlays represent a convenient way of directly comparing FCM data, this is often considered a main disadvantage of the software [2]. Secondly, FACSDiva does not allow the export of high-resolution image files of any type; neither copy/paste, nor Export Worksheet Elements result in satisfying image quality. Notably, even the new built-in Save as PDF function of FACSDiva is not able to generate high-resolution, vector-based images – instead it combines the low-resolution raster/pixel graphics in a PDF file. At the same time, FACSDiva software supports high-resolution printing of FACS plots, as can easily be seen on any printout generated with the software.
Since adequate, high-quality data presentation is an important precondition for publishing research results [3], we asked whether we could develop an easy manual for generating high-quality graphs for data obtained with FACSDiva. The basic idea of this manual is to trick FACSDiva by using its print functionality to generate a high-resolution, vector-based PDF file. Notably, conferring FACS plots into PDF files not only represents a convenient way of storing FCM data in an easy accessible format, but also allows the FACS plots to be later extracted in high-resolution quality, perfectly suitable for any kind of publication including large posters.
We here describe a Figure-improvement toolbox (Diva-Fit), which we find to be easy, fast and convenient. This toolbox facilitates the export of FACS data obtained with FACSDiva into high-resolution PDF files, the removal of unwanted quadrant labels (automatically adhered by FACSDiva) and the generation of histogram overlays. Importantly, all of the software used is distributed free of charge. It should be noted that the described strategy may also be performed by combining alternative programs to the ones used here. However, in exploring various tools we found the way described below to be the most convenient. In fact, with some experience even generation of high-resolution histogram overlays takes only a few minutes using the proposed protocol.
Material and Methods
Software tools used
Diva-Fit requires several programs to be installed on the computer. We made sure that, with the exception of FACSDiva, the required software is free of charge and can easily be obtained from Internet sources. Administrative rights are necessary to install the software. If you do not have enough rights to install software, ask your local system administrator.
The following programs have been used:
• BD FACSDiva 6.1.2
Any version should work
• PDFCreator 0.9.5
http://www.pdfforge.org/products/pdfcreator
This version or newer is recommended. Alternatively, other PDF printer drivers possibly already installed on the computer could be used (e.g., Adobe Acrobat comes with a PDF printer driver, the free Acrobat Reader does not). However, the method will be different.
• Adobe Acrobat Reader 9.1.0
http://get.adobe.com/uk/reader/otherversions/
We recommend using this version or newer.
• GIMP 2.6.4
http://www.gimp.org/downloads/
GIMP is only necessary for the creation of histogram overlays. This version or newer is recommended; however, older versions should work too. Alternatively, Adobe Photoshop could be used; the treatment is only slightly different. Not every image manipulation program offers all necessary features. GIMP is a very powerful program, but quite demanding because of its complexity.
• Inkscape 0.46
http://www.inkscape.org/download/
Inkscape is only necessary for the deletion of text within plots (e.g., quadrant labels). The most recent version should be used: version 0.46 or newer. Inkscape is a vector graphics editor that is also capable of modifying the content of PDF files. The low version number (0.46) represents the ongoing development status, and not everything works perfectly yet. Nevertheless, this program has a lot of features and is quite difficult to use.
Results
Diva-Fit, a toolbox for the generation of high-resolution FCM graphs
In this result section all steps of our manual are described in a concise form. For those researchers less familiar with the software tools we used, a very detailed description including screenshots is provided in the supplementary material. Part 1 describes how to generate high-resolution dot plots and histograms. Part 2 describes how to generate histogram overlays (this is based upon Part 1). Part 3 describes how to delete text within plots, e.g., quadrant labels in dot plots (also based upon Part 1).
Part 1: How to extract high-resolution dot plots and histograms from BD’s FACSDiva
Step 1: Obtaining and processing data with FACSDiva
FCM data are obtained and processed using FACSDiva. Dependent on the required style of final data presentation, dot or histogram plots can be designed. Importantly, if a histogram overlay needs to be created, it is essential to make the histograms the same size and to set the scaling of the Y-axis to identical values. To do so, mark both histograms and click the button Make Same Size. Then go to the Inspector (View --> Inspector) and at the Histogram tab, check Manual and Counts, then enter an appropriate value.
Step 2: Generation of high-resolution PDF files using PDFCreator
To convert the work sheet into a high resolution PDF file, click on File --> Print. Select the PDFCreator as the printer and click OK. When the dialog of the PDFCreator shows up, click Options to configure how the PDF files will be generated. This has to be done only once at the first use. On the left side in the menu Formats click on PDF, then on the Compression tab. Check Compress Text Objects and check Compress for all three types of images indicated; always select ZIP as compression mode. Make sure Resample is always unchecked. Now click Save to get back to the previous dialog. Click Save to save the PDF file and select the folder where the file should be stored.
Step 3: Export of images into a desired application (e.g., presentation tool such as PowerPoint) using Acrobat Reader
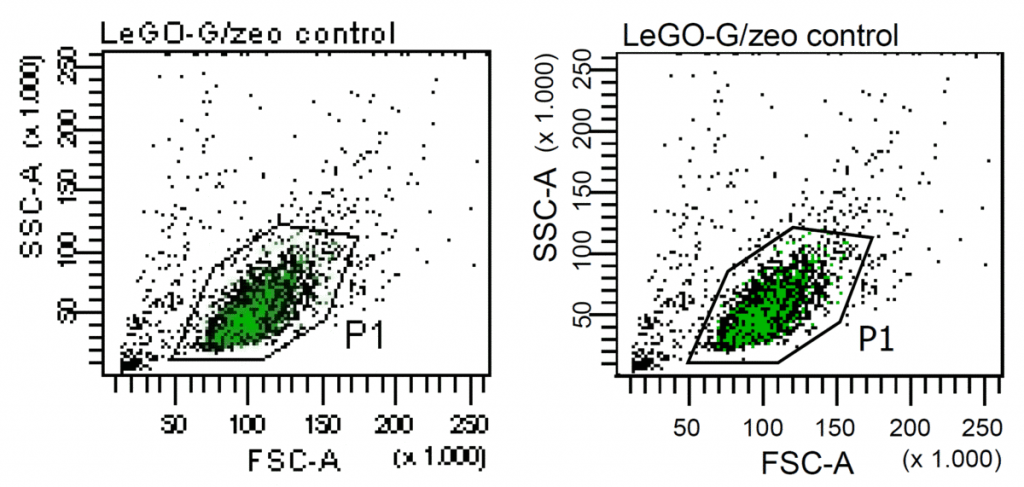
Open the PDF file with Adobe Acrobat Reader to select and copy the desired plots to any other application. The PDF file created in step 2 contains vector graphics, which even at high levels of zoom will be perfectly sharp and not pixelated. Figure 1 shows a comparison between a plot created by FACSDiva’s export function and a plot generated using our Diva-Fit strategy—the difference is obvious. Additionally, PDF files are well suited to archival for later use or to be sent by email, as they can be easily viewed on any computer without the need to have FACSDiva installed.
Figure 1. Diva-Fit facilitates generation of high-quality FACS plots. Even at the relatively low magnification shown, the image generated using the export function of FACSDiva (File --> Export --> Worksheet Elements) is strongly pixelated (left). In striking contrast, the high-resolution graph generated using our Diva-Fit strategy (right) appears very sharp. The depiction of single cells as squares is definite and therefore remains unaltered.

To simplify the export of plots, the resolution in Acrobat Reader should be set to a fixed value. Click Edit --> Preferences and select the category General, check the option Use fixed resolution for Snapshot tool images and enter the value 720 pixel/inch. This is the highest value allowed by Acrobat Reader. Click OK.
Now use the Snapshot tool to copy a FACS plot to the clipboard (Tools --> Select&View --> SnapshotTool). Press and hold down the left mouse button to mark the desired FACS plot. Acrobat Reader then automatically copies the marked area to the clipboard.
Now open the application where the plot should be pasted to, such as PowerPoint or Word and click edit --> paste. The FACS plot will appear in high resolution, as a 720 pixel/inch bitmap.
Part 2: How to generate histogram overlays using GIMP (based upon Part 1)
If a histogram overlay needs to be created, the respective plots have to be pasted into and processed within a graphic-editing program able to create overlays, such as GIMP. First, copy histogram 1 to the clipboard using Acrobat Reader and paste it as a new image into GIMP. To do so, open GIMP and click File --> Create --> From Clipboard in the menu bar.
Now switch back to Acrobat Reader and copy histogram 2 to the clipboard (which has ideally been set to another color in FACSDiva beforehand). Make sure both histograms are of the same size (see step one); this is essential. Histogram 2 has to be pasted as a new layer into the same image file of GIMP. To do so, click Edit --> Paste as --> New Layer.
The image file now contains the two histograms lying on top of each other in two Layers. In the layers dialog of GIMP (usually at the right side, otherwise press Ctrl+L) the two layers are shown as well as the Layer Mode (set to Normal as default). The mode determines how the layers interact with each other and may be used to combine the two histograms into one overlay graph. To this aim, set the layer Mode to Multiply. Now both layers are visible at the same time, but not yet aligned. To align both histograms, set the Zoom function to 100% (View --> Zoom --> 100%). Select the Move Tool (Tools --> Transform Tools --> Move), click on one of the histograms and use the cursor keys of your keyboard to move it until both histograms are fully aligned.
Set the Zoom back to about 33% (View --> Zoom --> 33%) to see the entire histogram overlay. If the two histograms had different titles, the overlay may result in an unreadable text mixture. This can be initially avoided in FACSDiva (by applying identical or no titles), or corrected in GIMP, e.g., by using the Eraser Tool (Tools --> Paint Tools --> Eraser).
To save the image, click on File --> Save as, enter a filename such as Overlay1.tif to save the file as a TIFF image. Now select a folder and click OK. In the next dialog choose merge visible layers, and then check LZW to use a lossless compression for the TIFF-file. This saves space without reducing image quality. In the supplemental material hints are given how the design of histogram overlays could be altered.
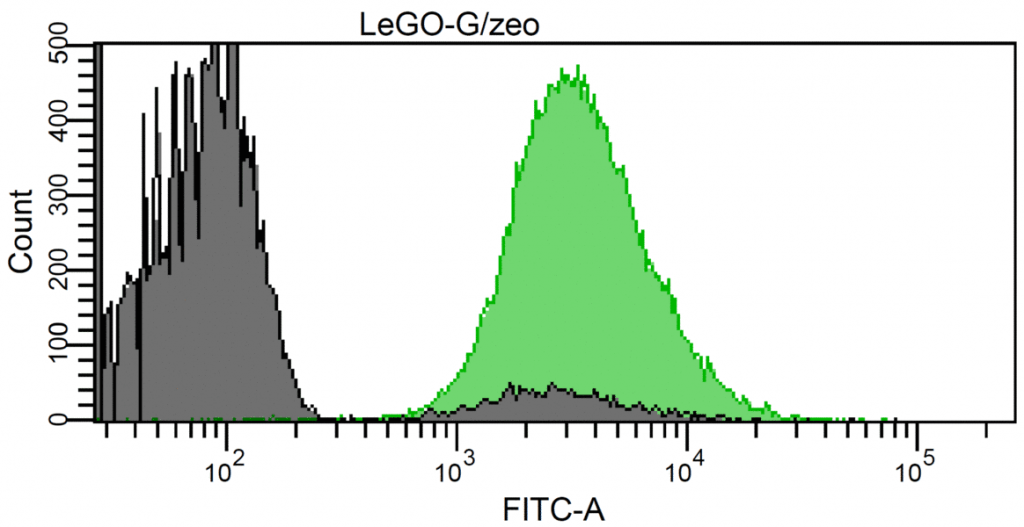
In Figure 2, an example is provided in which a fusion protein consisting of EGFP and ZeoR has been expressed in 293T cells using LeGO vectors [4]. The histogram overlay shows transduced cells before and after selection with zeocin.
Figure 2. Straightforward composition of histogram overlays. 293T cells were transduced with a LeGO vector [4], encoding a fusion protein consisting of EGFP and ZeoR (Weber et al., submitted). Gene transfer reached 10%, i.e., 90% of the cells remained EGFP-negative (dark grey histogram). After selection with Zeocin, almost all remaining cells were EGFP-positive (99.8%; green histogram).

Part 3: How to delete quadrant labels (Q1–Q4) within dot plots (based upon Part 1)
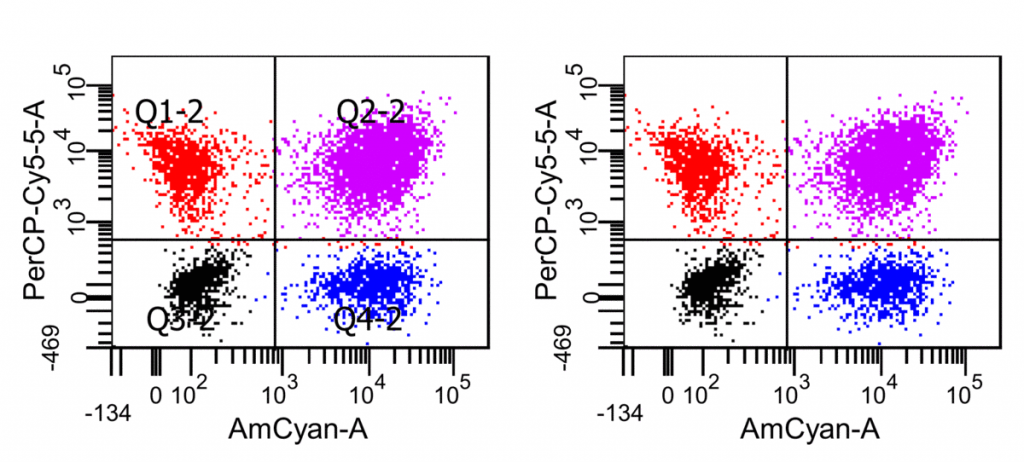
Here we describe two possibilities of fulfilling this task: the first one is a bit easier, but the second one uses free software (see Figure 3).
Figure 3. Removal of annotations within plots, absolutely residue-free. Annotations within plots may hide cells and disturb a clear figure (left plot). Unfortunately, in FACSDiva it is impossible to disable, hide, or delete quadrant labels. As illustrated, Diva-Fit can quickly remove unwanted labels, residue-free, without modifying a single dot of the dot plot (right plot).

Although it is not free, Adobe Acrobat is available in many labs. Removal of labels from FACS plots with this software is quite convenient. Please note that the described procedure does not work with the free Adobe Acrobat Reader. Open the PDF file generated by PDFCreator in Adobe Acrobat. Click on Tools --> Advanced Editing --> TouchUp Text Tool. Then click on the label you want to remove. Now the text of that label can be deleted or even modified as you like. The modified PDF file can be saved if desired. The export of the modified plots into other programs works as described in part 1 of this manual.
The alternative possibility relies on Inkscape, which needs to be installed on the computer. Start Inkscape and open the PDF file generated by PDFCreator (File --> Open). If the PDF contains more than one page, select which page to import at the top of the dialog box and click OK. Inkscape now shows the content of the PDF file as a single element. Fortunately, it is able to ungroup the vector elements of the plots. Right click on a plot and choose Ungroup. After the ungrouping all single elements are selected. Now select the labels that should be deleted and press delete on the keyboard. If the element you want to delete cannot be selected separately, try to ungroup it again (right click --> Ungroup). Since Inkscape is able to individually remove the vector element containing the quadrant labels, it leaves the dots/cells completely untouched (for more details please refer to the Supplement).
The modified plot can easily be exported as a high-resolution bitmap file. Press and hold down the left mouse button to mark the entire FACS plot. Then click on File --> Export Bitmap. The export dialog automatically is set to Selection—thus the selected plot will be exported exclusively. Also, the desired resolution can be set in the export dialog – 600 dpi (up to 1200 dpi is possible) is a good value. Now click on Browse to choose a folder where the file should be stored in and click on Export. Inkscape always exports bitmaps as PNG files which can be easily used in almost every other application (like PowerPoint or Word) or converted to TIFF files without loss of quality using GIMP.
Discussion
Graphical presentation of FCM data acquired and/or processed using FACSDiva software often suffers from low quality, since plots generated with this software frequently appear pixelated, in particular at large magnifications (e.g., at poster size). This is most unfortunate, since high-quality presentation is a sine qua non for adequate perception and publication of any data [3].
We have developed an easy and straightforward toolbox, Diva-Fit, for the high-quality presentation of FCM data obtained/processed with FACSDiva. To do so, we utilize the built-in high quality print function of FACSDiva software and adapt it to create high-resolution graphs in PDF format with a much superior quality. Importantly, these high-quality illustrations can easily be included into any presentation format, e.g., MS Word, PowerPoint or similar applications. Additionally, the PDF format is very convenient for storage and exchange of data, since it can be viewed and processed on computers not equipped with FACSDiva.
Diva-Fit might be particularly interesting for many researchers in the field who require fast and convenient generation of histogram overlays, a feature badly missed in all FACSDiva versions. It needs to be noted that there are commercially available programs which might be used to re-analyze FCS files obtained with FACSDiva, e.g. in order to create overlay plots. Programs such as FlowJo (Tree Star, Ashland, OR) are powerful tools with multiple features. However, besides the significant costs for obtaining additional software, its operation is usually quite complex and requires additional training. In contrast, the toolbox described here was essentially developed in order to present data obtained with FACSDiva at better quality. A typical further example for such application is the opportunity to easily delete or modify perturbing annotations automatically set by FACSDiva, e.g. quadrant labels, using Diva-Fit.
In conclusion, we believe that Diva-Fit will be valuable for many users of BD flow cytometers equipped with FACSDiva software in optimizing FCM data presentation.
Supplementary material
Acknowledgement
This work was supported by the Deutsche Forschungsgemeinschaft (DFG-FE568/11-1). This work is part of the doctoral thesis of Kristoffer Weber.
References
1. Shapiro HM. Practical Flow Cytometry. John Wiley & Sons Inc. 2003.
2. https://lists.purdue.edu/pipermail/cytometry/2004-January/025976.html (May 15, 2009);
https://lists.purdue.edu/pipermail/cytometry/2007-November/033816.html (May 15, 2009).
3. Neill US. How to write a scientific masterpiece. J Clin Invest 2007;117:3599-3602. doi:10.1172/JCI34288. Open Access
4. Weber K, Bartsch U, Stocking C, Fehse B. A multi-color panel of novel lentiviral "gene ontology" (LeGO) vectors for functional gene analysis. Mol Ther. 2008;16:698–706. doi: 10.1038/mt.2008.6. Open Access (Supplemental information)
Accepted 03 July 2009
Published 04 August 2009


