Diva-Fit: A step-by-step manual for generating high-resolution graphs and histogram overlays of flow cytometry data obtained with FACSDiva software – Supplementary material
Kristoffer Weber, Boris Fehse
Research Dept. Cell and Gene Therapy, Clinic for Stem Cell Transplantation, UCCH, University Medical Centre Hamburg-Eppendorf, Germany
Correspondence:
Research Dept. Cell and Gene Therapy, Clinic for Stem Cell Transplantation, UCCH, University Medical Centre Hamburg-Eppendorf, Martinistr. 52, 20246 Hamburg, Germany
Phone: +49-40-7410-52705 / +49-40-7410-55518
E-mail: k.weber@uke.de or fehse@uke.de
Accepted 03 July 2009
Published 04 August 2009
Summary
Here we describe all procedures depicted in the named article in more detail.
Part 1: How to extract high-resolution dot plots and histograms from FACSDiva
Part 2: How to generate histogram overlays (based upon Part 1)
Part 3: How to delete quadrant labels (Q1–Q4) within dot plots (based upon Part 1)
Part 1: A detailed description of Diva-Fit - how to extract high resolution dot plots and histograms from BD’s FACSDiva software
The FACSDiva software itself is unable to export any high-resolution image files; neither copy/paste, nor Export Worksheet Elements result in satisfying image quality. Interestingly, even the new built-in Save as PDF function of FACSDiva is not able to generate such high resolution, vector-based files – instead it combines the low-resolution raster/pixel graphics in a PDF file. However, FACSDiva supports high-resolution printing, as can easily be seen on any printout generated with the software. In this supplement a detailed description shows how FACSDiva can be “tricked” into producing high-resolution images, using its print functionality and a vector-based PDF file as intermediate step. Below we describe the Diva-Fit procedure step-by-step. With some experience, even the generation of high-resolution histogram overlays will only take a few minutes using Diva-Fit.
Our proposed strategy (Diva-Fit) requires several programs to be installed on the computer. We made sure that, with the exception of FACSDiva, the required software is free of charge and can be easily obtained via download. Administrative rights are necessary to install the software. If you do not have enough rights to install software, ask your local system administrator to install the following software tools.
• BD FACSDiva 6.1.2 (any version should work)
• PDFCreator 0.9.5
http://www.pdfforge.org/products/pdfcreator
This version or newer is recommended. Alternatively, other PDF printer drivers possibly already installed on the computer could be used (e.g., Adobe Acrobat comes with a PDF printer driver; the free Acrobat Reader does not). However, the method will be different.
• Adobe Acrobat Reader 9.1.0
http://get.adobe.com/uk/reader/otherversions/
We recommend this version or newer. Older versions may not provide all the features required.
Step 1: Obtaining and processing data with FACSDiva
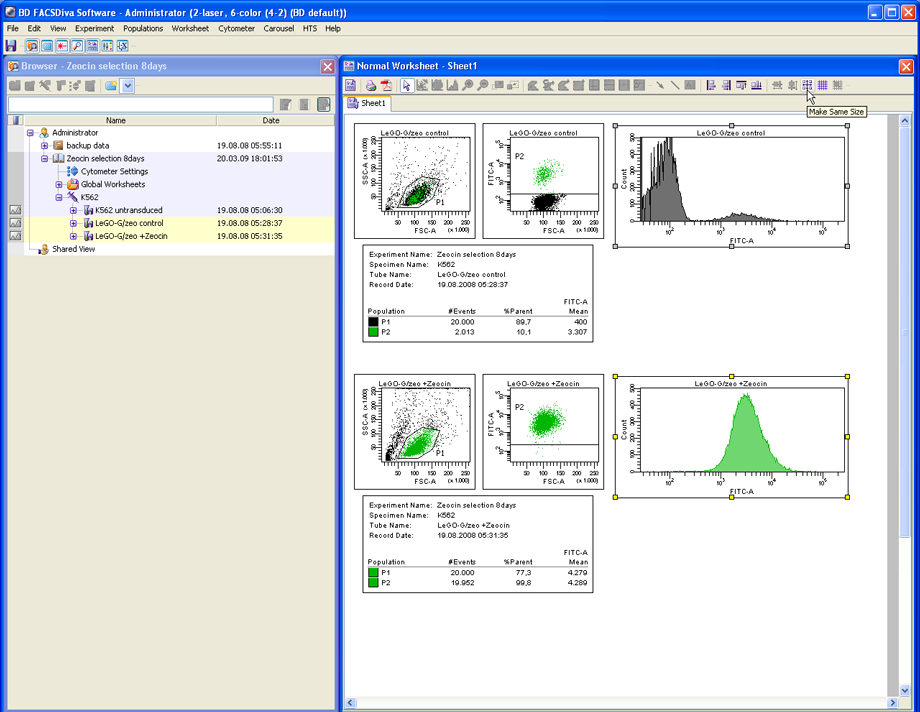
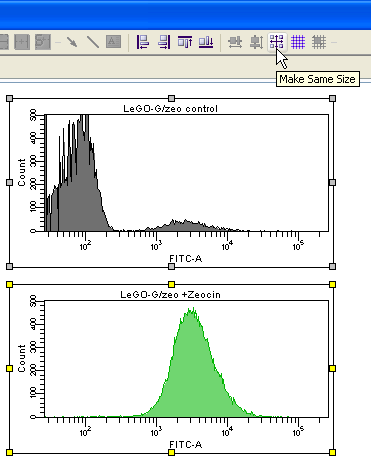
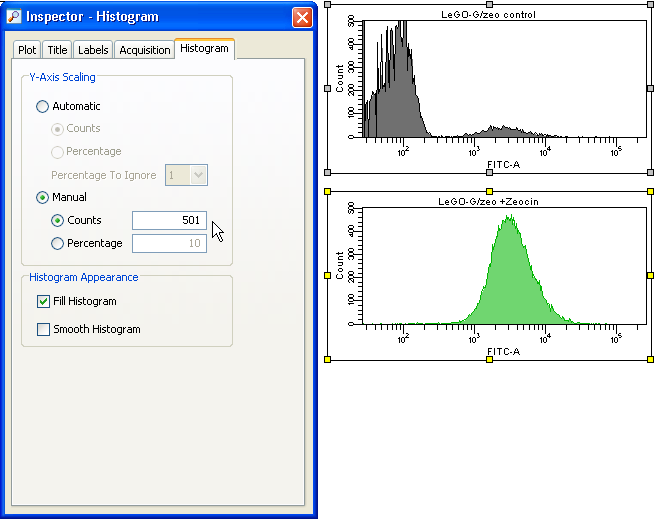
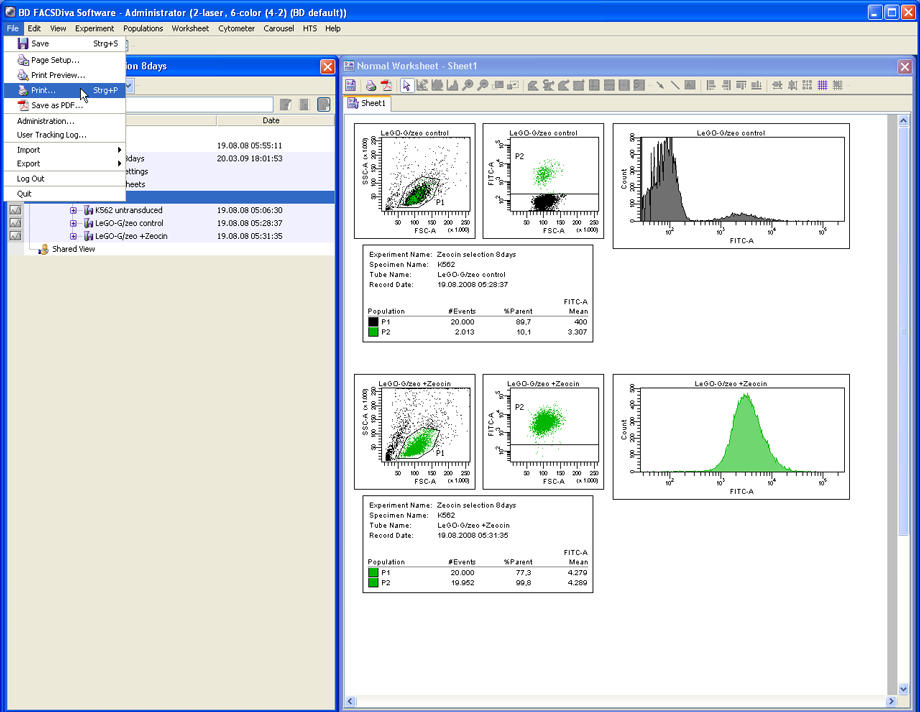
Prepare your FACS analysis in FACSDiva as usual. This example shows cells expressing a fusion protein consisting of EGFP and ZeoR, rendering the cells EGFP positive and resistant to zeocin (lower panels after selection). Importantly, if a histogram overlay needs to be created, it is essential to make the histograms the same size and to set the scaling of the Y-axis to identical values. To do so, mark both histograms and click the button Make Same Size. Then go to the Inspector (View --> Inspector) and at the Histogram tab, check Manual and Counts, then enter an appropriate value.
Step 2: Generation of high-resolution PDF files using PDFCreator
To convert the work sheet into a high resolution PDF file, click on File --> Print. Select PDFCreator as the printer and click OK.
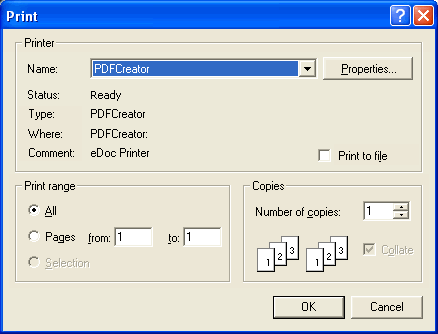
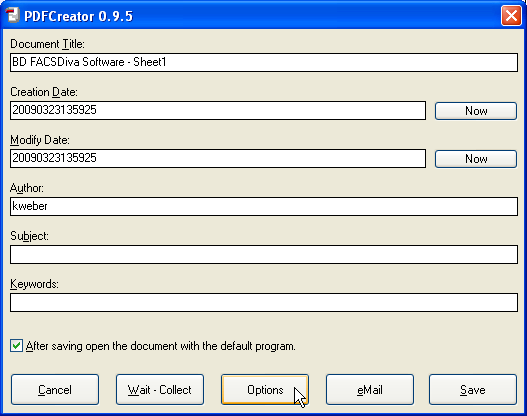
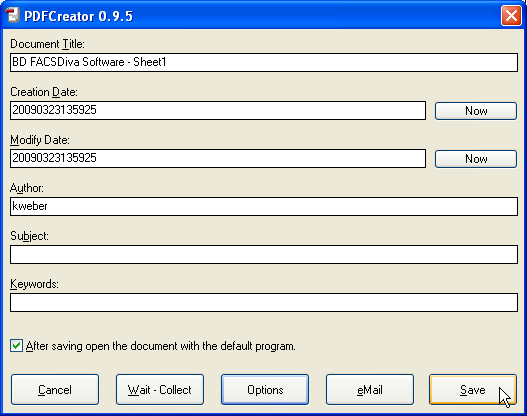
When the dialog of PDFCreator shows up, click Options to configure how the PDF files will be generated. This only has to be done the first time.
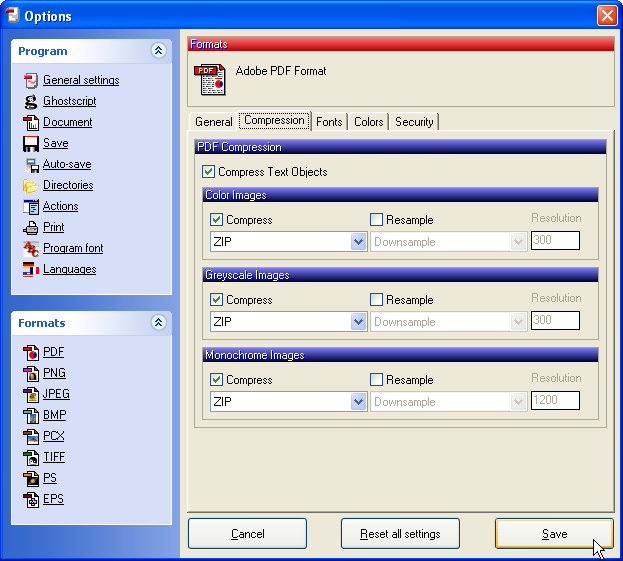
In the Formats menu, click on PDF, then on the Compression tab. Adjust the compression settings according to the picture below (check Compress Text Objects and check Compress for all three types of images, always select ZIP as compression mode). Make sure Resample is always unchecked. Now click Save to get back to the previous dialog.
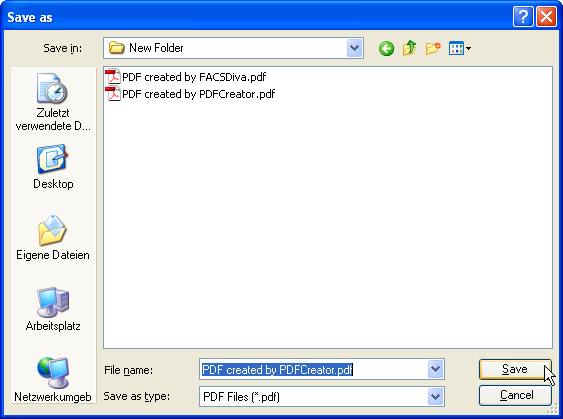
Click Save to save the PDF file and select the folder where the file should be stored.
Step 3: Export of images into a desired application (e.g., presentation tool such as PowerPoint) using Acrobat Reader
Open the PDF file in Adobe Acrobat Reader to select and copy the desired plots to any other application. This PDF file contains vector graphics and even at high levels of zoom the text will be perfectly sharp and not pixelated.
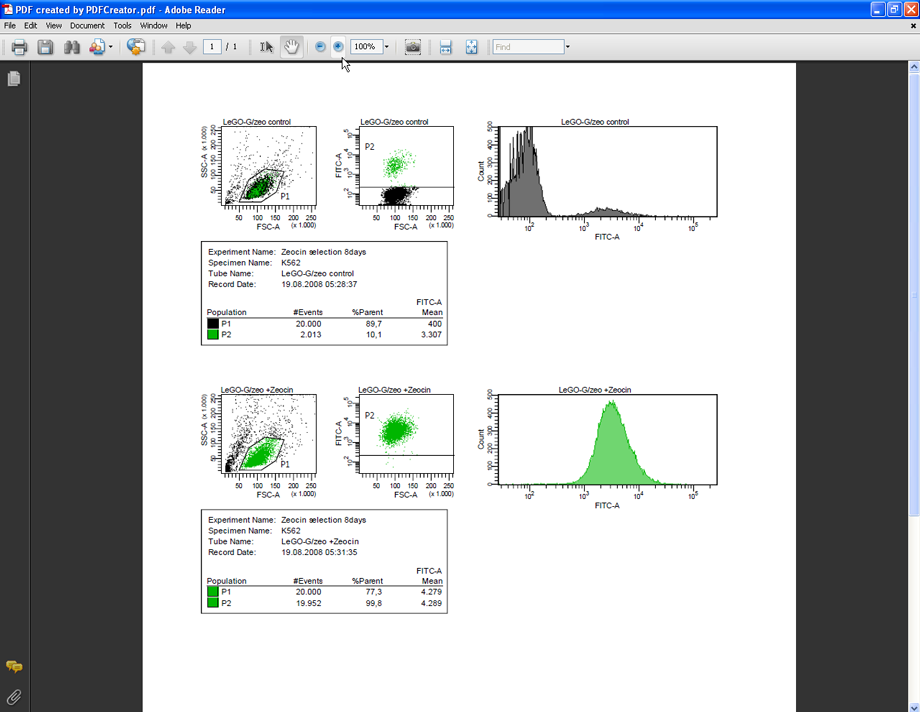
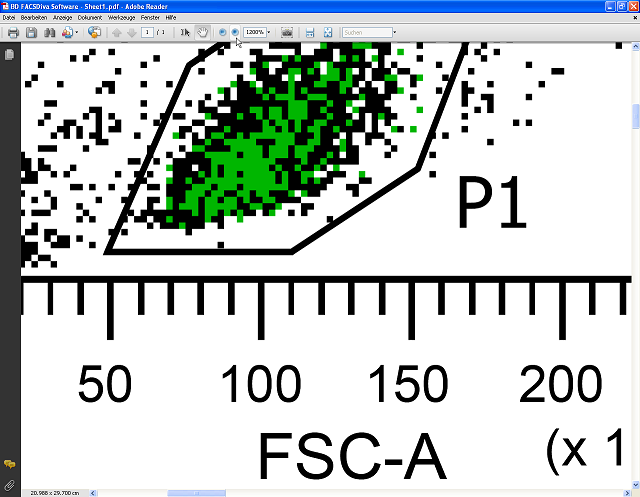
The next two pictures show a comparison between the PDF file created by PDFCreator and a PDF file created by FACSDiva using its Save as PDF function – the difference is obvious. Additionally, these PDF files are well suited to archival for later use or to be sent by email as they can be easily viewed without the need to have FACSDiva installed.
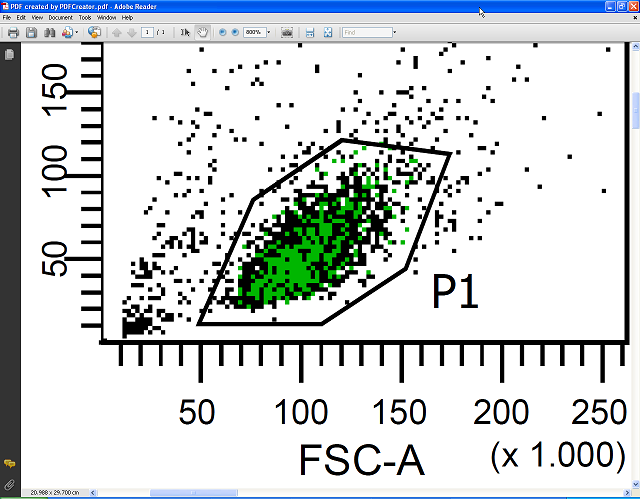
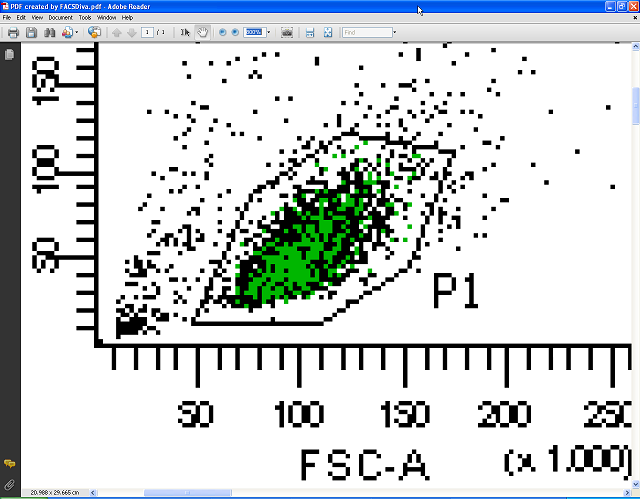
Below you see the PDF file containing vector graphics zoomed to 1200%. It stays perfectly sharp; no pixelation is visible. In contrast to FACSDiva, Acrobat Reader allows the export of FACS plots in high resolution raster graphics suitable for use in presentations or as publication-quality figures in other graphics editing programs or office suites, and/or for high quality prints.
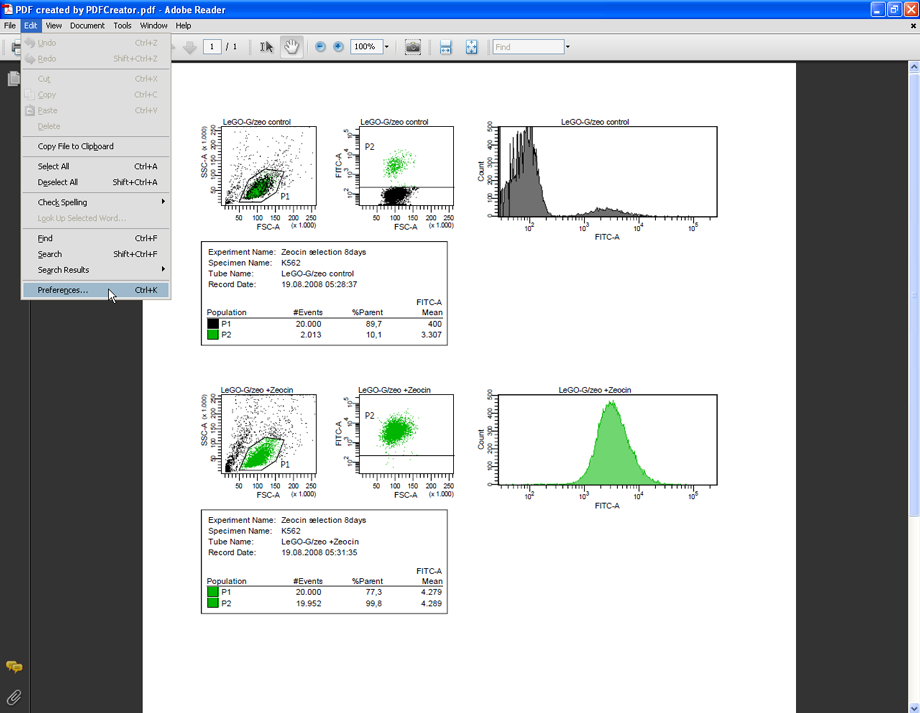
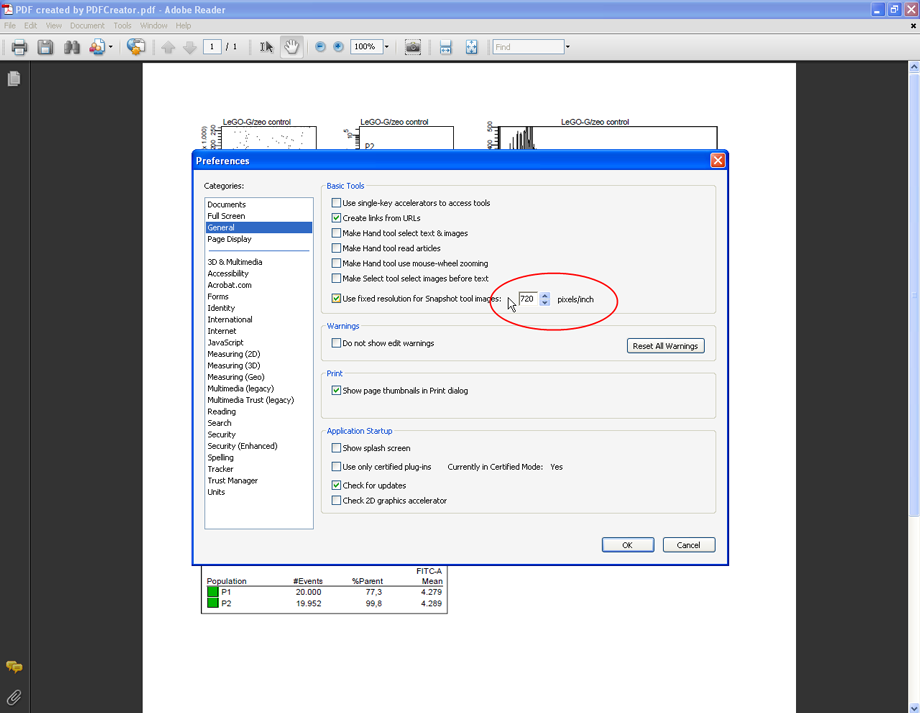
To simplify the export of plots in Acrobat Reader, the resolution should be set to a fixed value. Click Edit --> Preferences and select the category General, check the option Use fixed resolution for Snapshot tool images and enter the value 720 pixel/inch. This is the highest value allowed by Acrobat Reader. Click OK.
Now use the Snapshot tool to copy a FACS plot to the clipboard (Tools --> Select&View --> SnapshotTool). Press and hold down the left mouse button to mark the desired FACS plot. Acrobat Reader will automatically copy the marked area to the clipboard (720 pixel/inch).
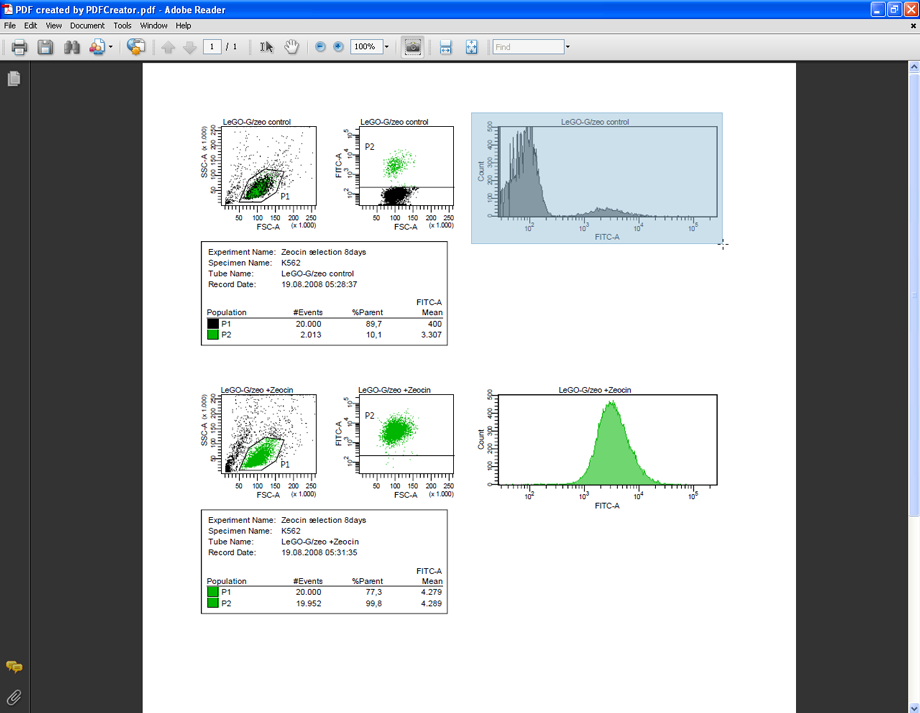
Now open the application where the plot should be used, such as PowerPoint or Word, and click edit --> paste. The FACS plot will appear in high resolution, as a 720 pixel/inch bitmap.
Part 2: How to generate histogram overlays (based upon Part 1)
Additional software is needed for part 2, which is also available free:
• GIMP 2.6.4
http://www.gimp.org/downloads/
GIMP is only required for the creation of histogram overlays. This version or newer is recommended; however, older versions should work, too. Alternatively, Adobe Photoshop could be used; the treatment is only slightly different. However, not every image manipulation program offers all necessary features. GIMP is very powerful software, but quite demanding because of its complexity.
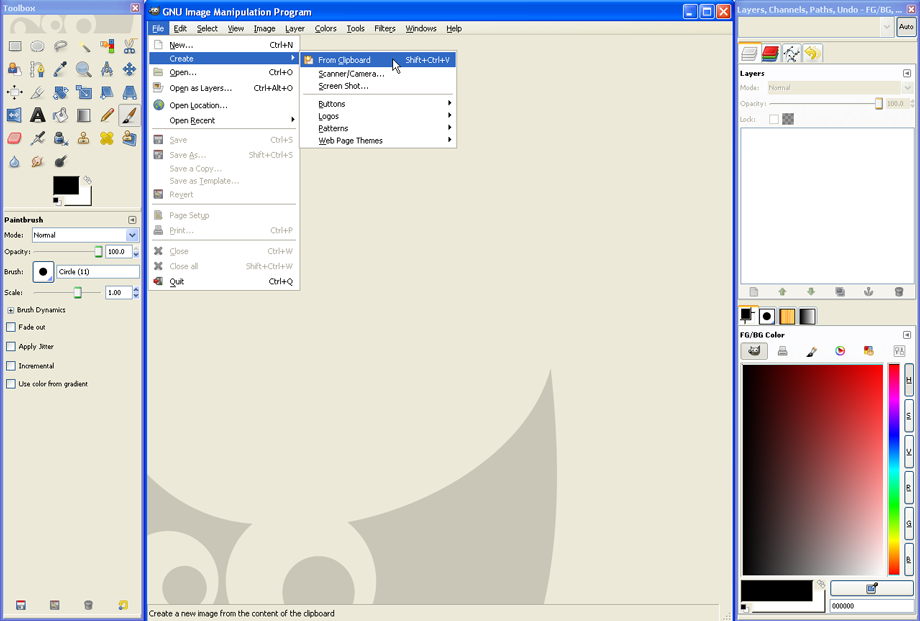
If a histogram overlay should be created, the plot has to be pasted into a graphic-editing program able to create overlays, as GIMP can. Use Acrobat reader to copy the first histogram to the clipboard (as described in part 1) and paste it as a new image in GIMP. To do so, open GIMP and click File --> Create --> From Clipboard.
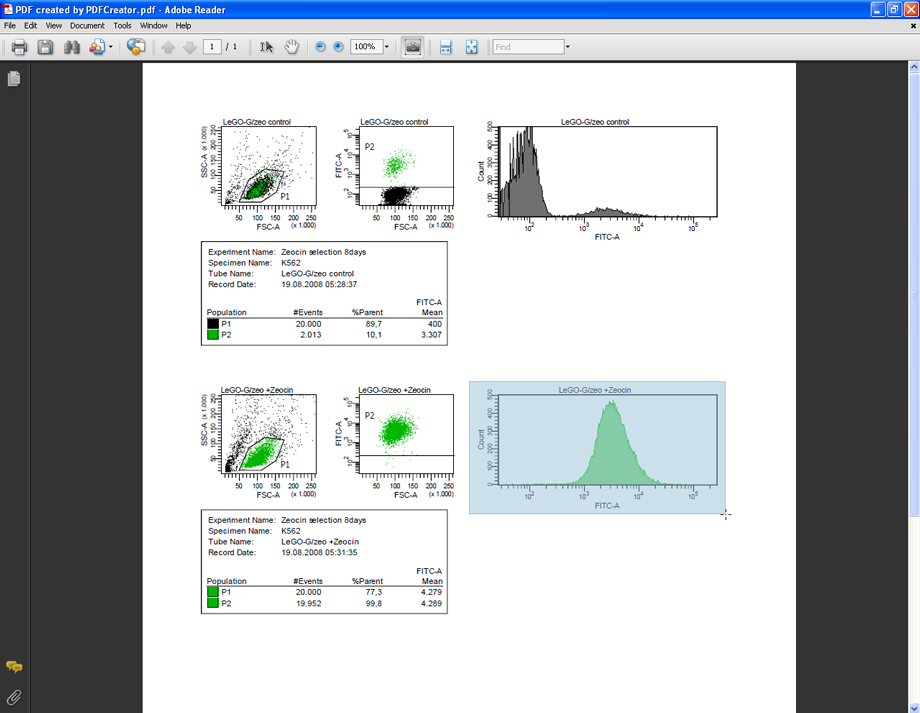
Next, copy the second histogram to the clipboard (which has ideally been set to another color in FACSDiva beforehand). Make sure both histograms are of the same size; this is essential (see step one).
This second histogram has to be pasted as a new layer into the same image file of GIMP, to do so click Edit --> Paste as --> New Layer.
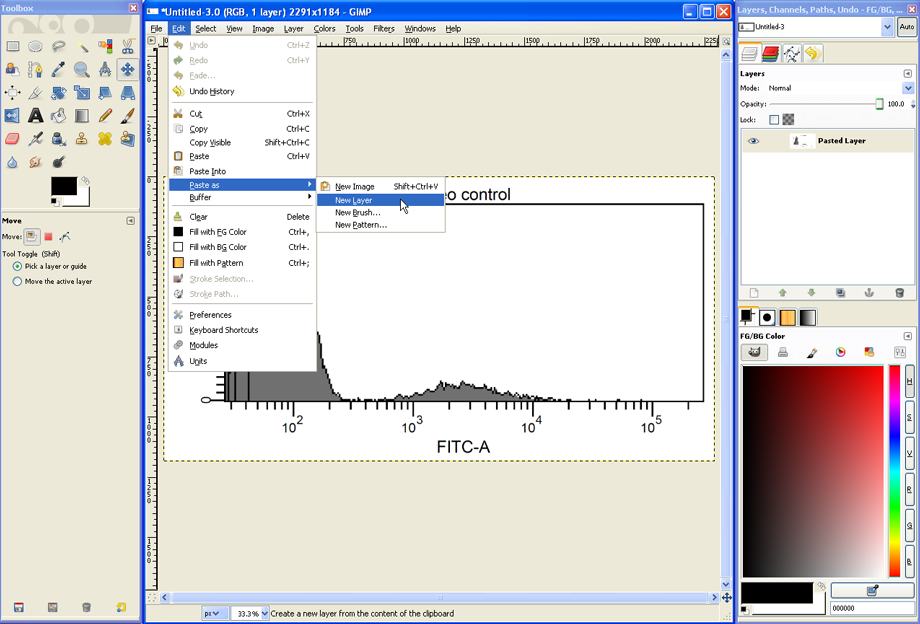
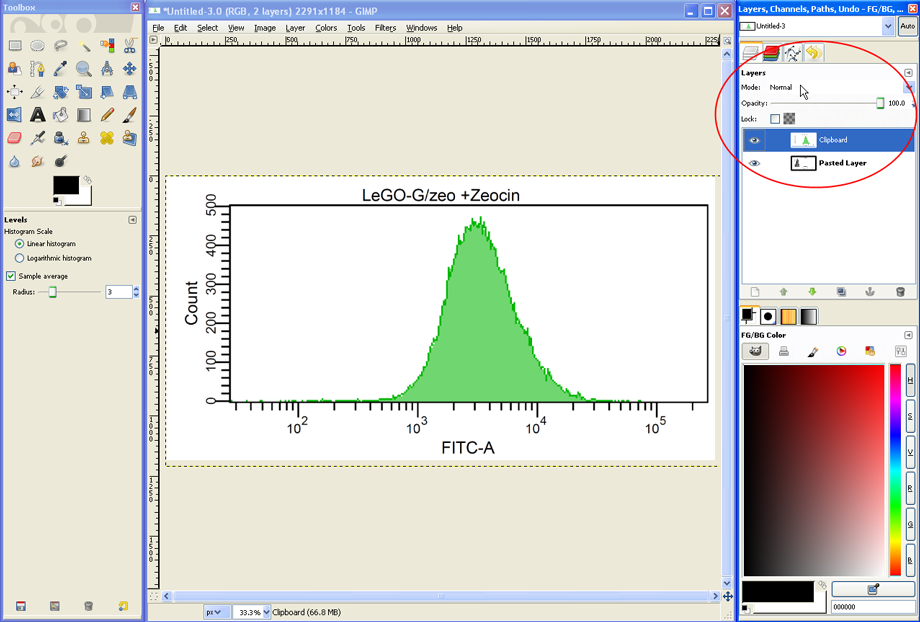
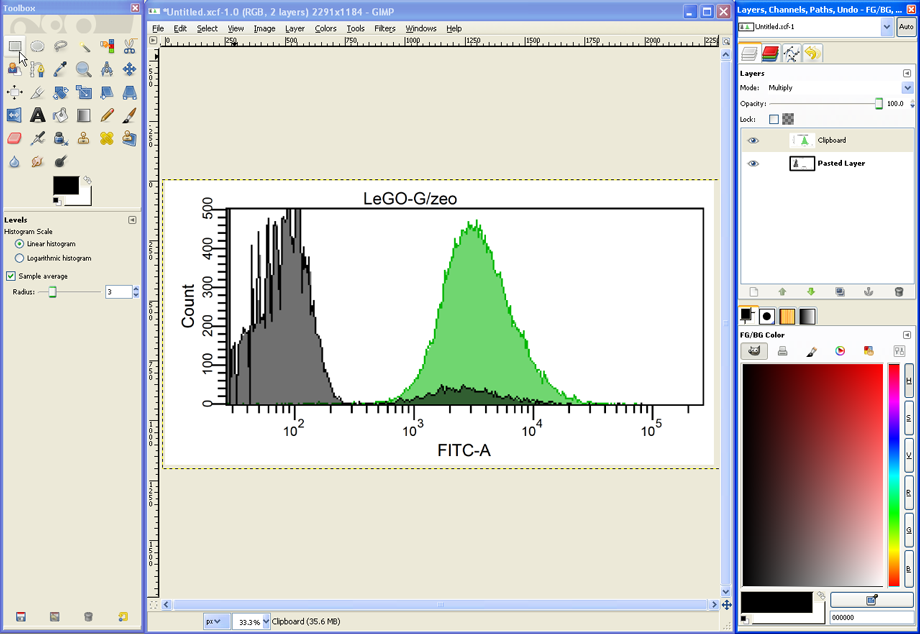
The image file now contains the two histograms collocated on top of each other in two Layers. In the layers dialog (see red circle) the two layers are shown as well as their current Mode (set to Normal as default). The mode determines how the layers interact with each other and can thus be used to combine the two histograms into an overlay graph.
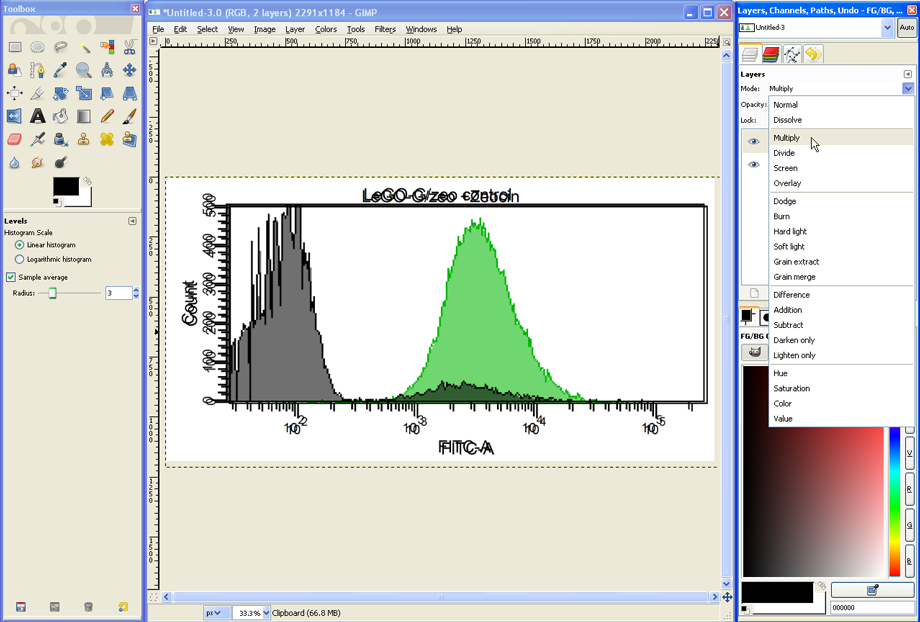
As a first step, set Mode to Multiply. Now both layers are visible, but not yet aligned.
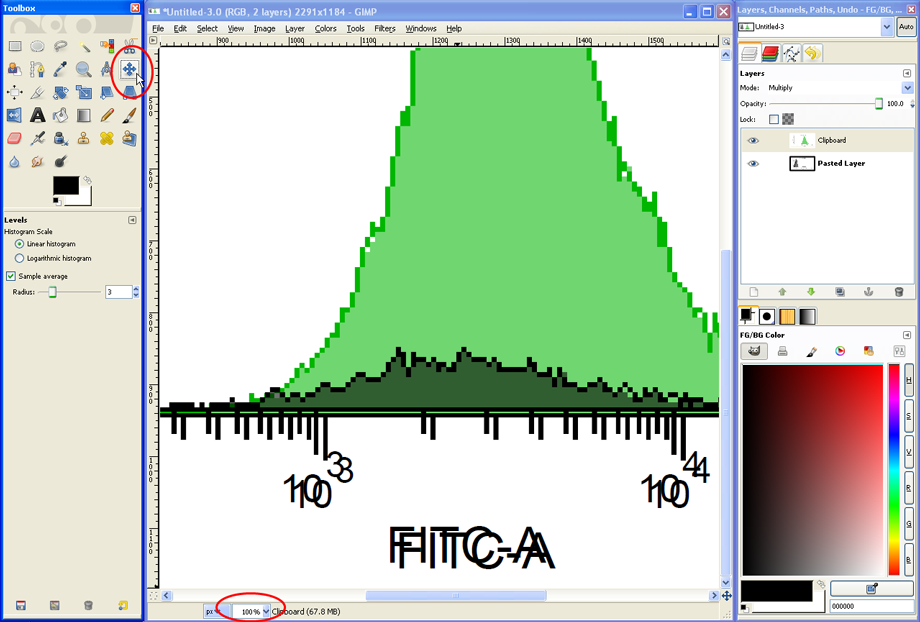
To align both histograms, set the Zoom to 100% (see lower red circle). Select the Move Tool (see upper red circle), click somewhere on the histogram to activate the given window and use the cursor keys of your keyboard to move one histogram until both histograms are aligned.
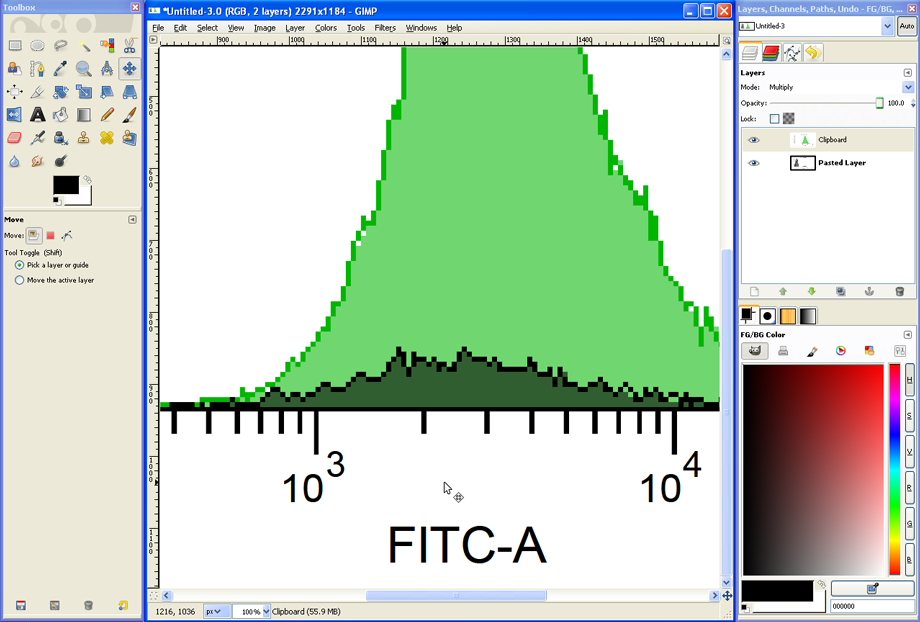
Set the Zoom back to about 33% to see the entire histogram overlay. If the titles of the two histograms were different, a mixed and therefore unreadable overlay of text will appear. This can be avoided in FACSDiva from the start (identical or no titles) or corrected in GIMP, e.g., by using the Eraser Tool.
To save the image, click on File --> Save as, enter a filename such as Overlay1.tif to save the file as a TIFF image. Now select a folder and click OK. In the next dialog choose merge visible layers, and then check LZW to use a lossless compression for the TIFF-file. This saves space without reducing image quality.
Part 2 B (optional): Further modifications
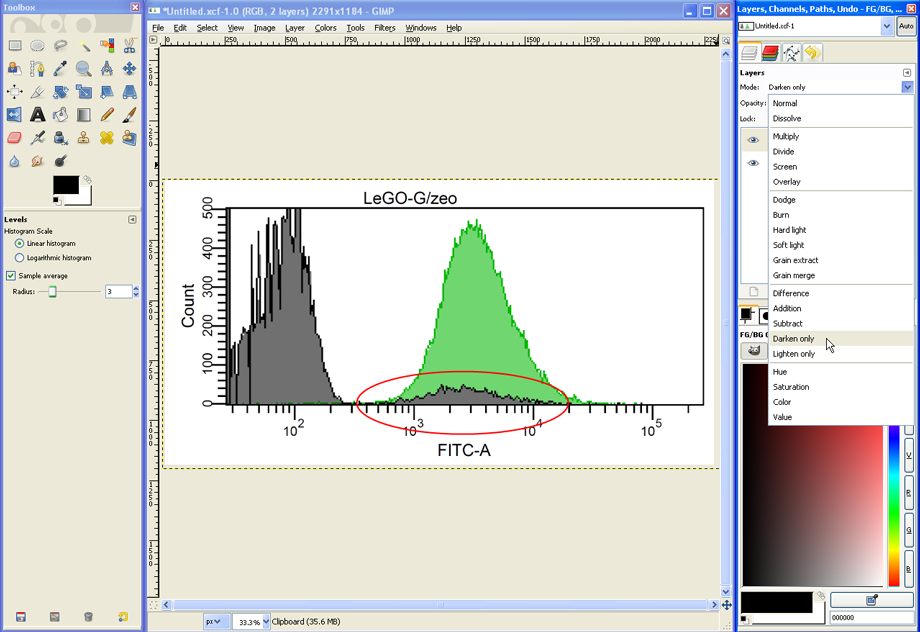
If desired, the appearance of the overlay can be altered in many ways. Setting the Mode for example to Darken only changes the way the two layers are combined (compare detail in red circle).
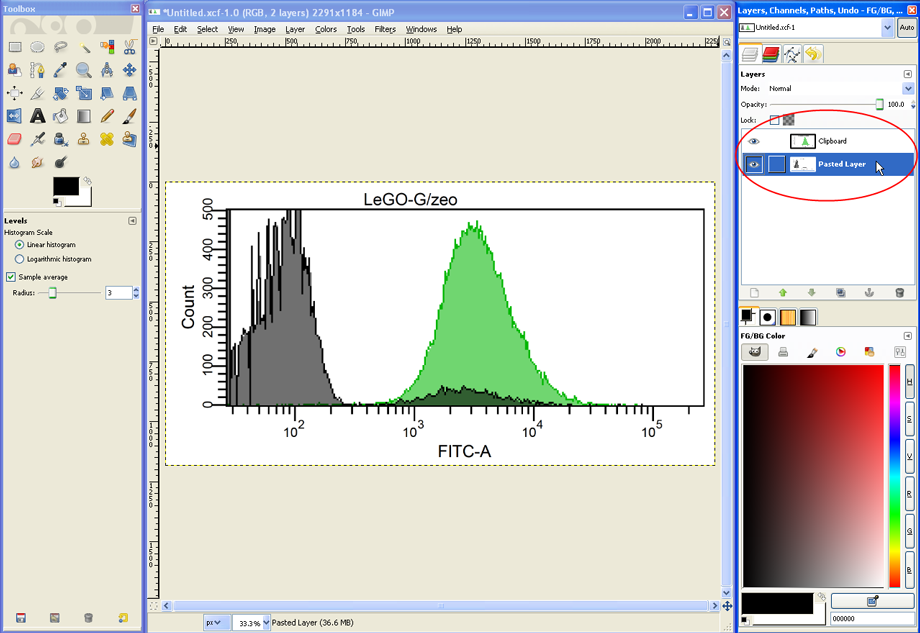
For another modification, in the layers dialog click on the layer with the grey histogram…
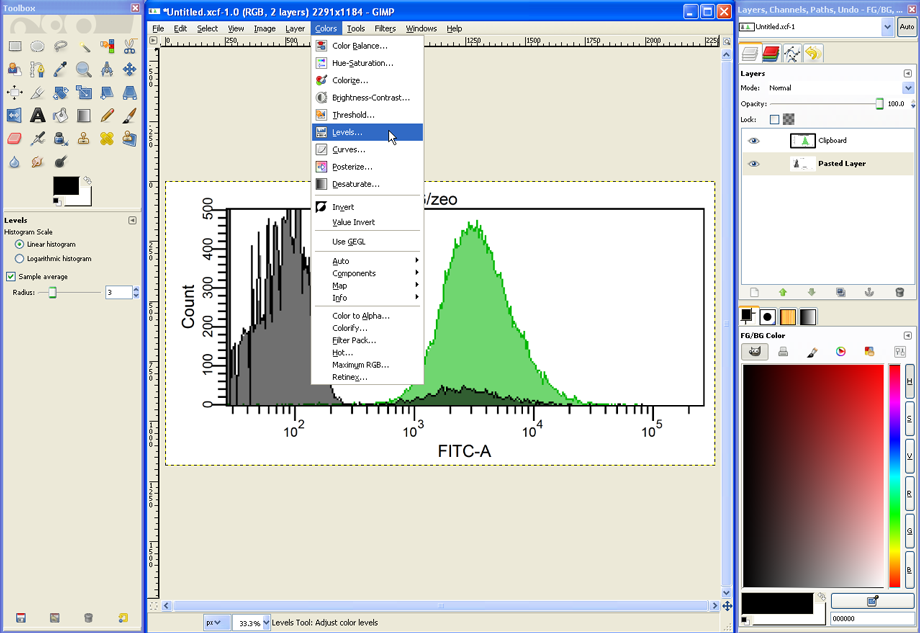
…and then choose Colors --> Levels.
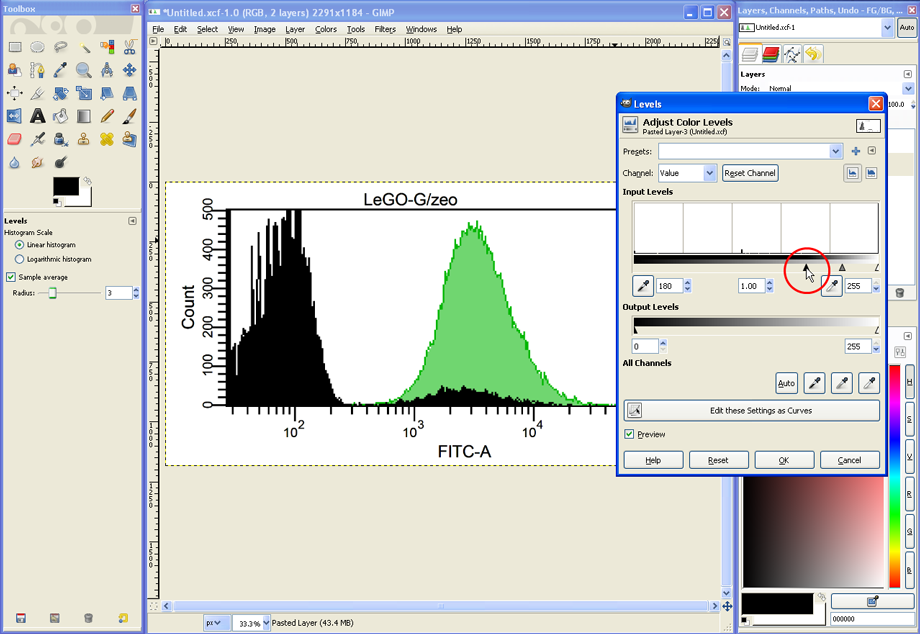
In the Levels dialog, the grey histogram could be turned into black by moving the black triangle to the right (see red circle).
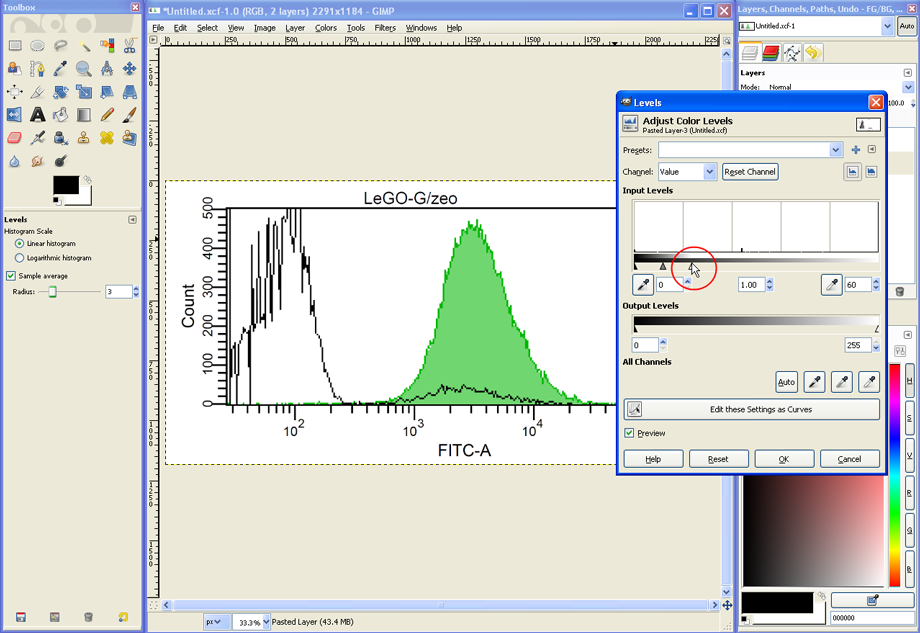
Alternatively, it could be made transparent by moving the white triangle to the left (see red circle).
Part 3: How to delete quadrant labels (Q1–Q4) in dot plots (based upon Part 1)
Additional software is needed for part 3. Only the second alternative uses free software:
• Adobe Acrobat
Although it is not free, Adobe Acrobat is available in many labs and quite convenient for removing labels from FACS plots. This procedure does not work with the free Acrobat Reader. Open the PDF file generated by PDFCreator in Adobe Acrobat.
Click on Tools --> Advanced Editing --> TouchUp Text Tool. Then click on the label you want to remove. Now the text of that label can be deleted or even modified as you like. The modified PDF file can be saved if desired. The export of the modified plots into other programs works as described in part 1 of this manual.
• Inkscape 0.46
http://www.inkscape.org/download/
The most recent version should be used: at least version 0.46. Inkscape is a vector graphics editor, also able to modify PDF files. The low version number (0.46) represents the ongoing development status, and not everything works perfectly yet. Nevertheless, this program has a lot of features and is quite difficult to use.
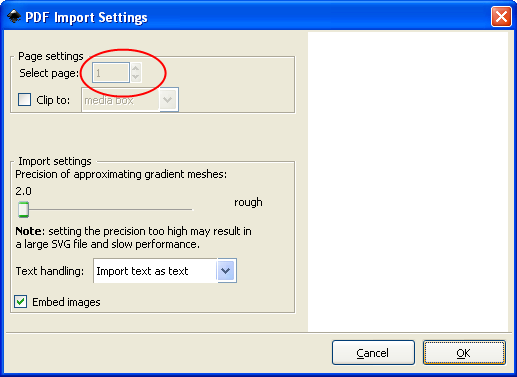
Start Inkscape and open the PDF file generated by PDFCreator (File --> Open). If the PDF contains more than one page, select which page to import (see red circle) and click OK.
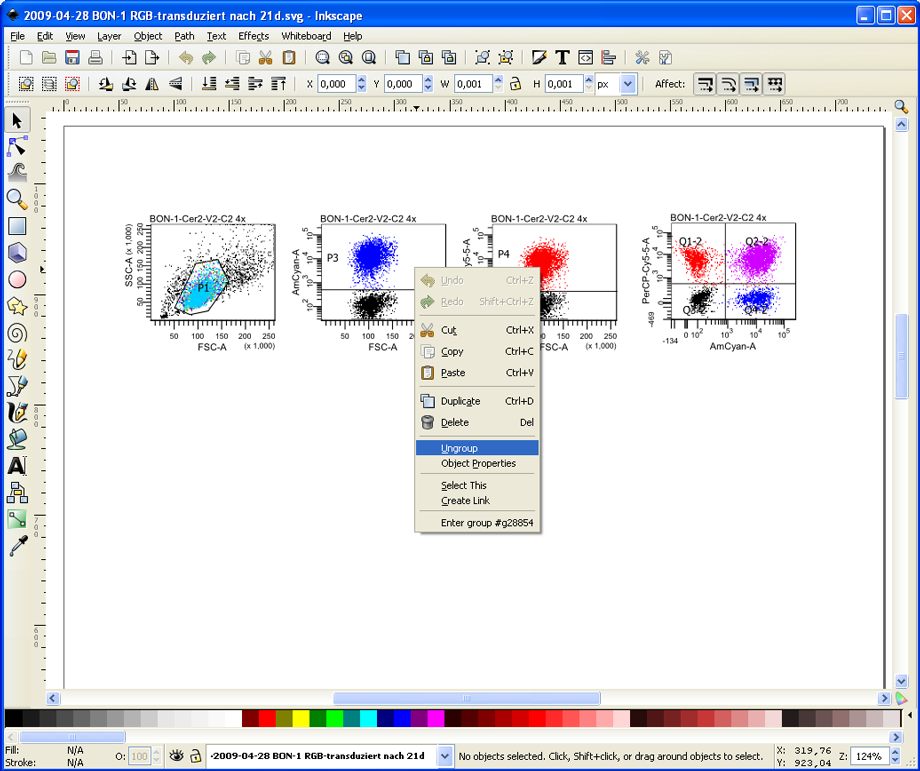
Inkscape shows the content of the PDF file as a single element. Fortunately, it is able to ungroup the vector elements of the plots. Right click on a plot and choose Ungroup.
After the ungrouping all single elements are selected. The first time it might be confusing that there will also be a white square behind all the elements. This should be deleted for convenience. To do so, click somewhere outside of the marked area to unselect everything. Then click on the white background and press Del on your keyboard to delete it.
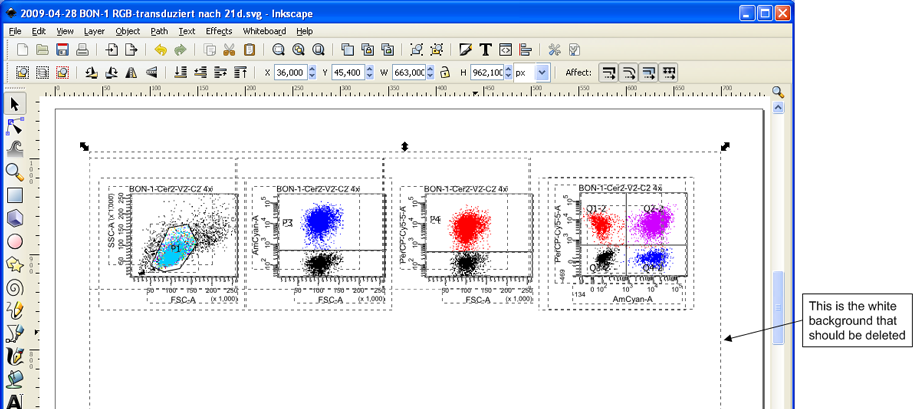
Now select the labels that should be deleted and press Del. In this example the quadrant names are selected. If the element you want to delete cannot be selected separately, try to ungroup it again (right click --> Ungroup).
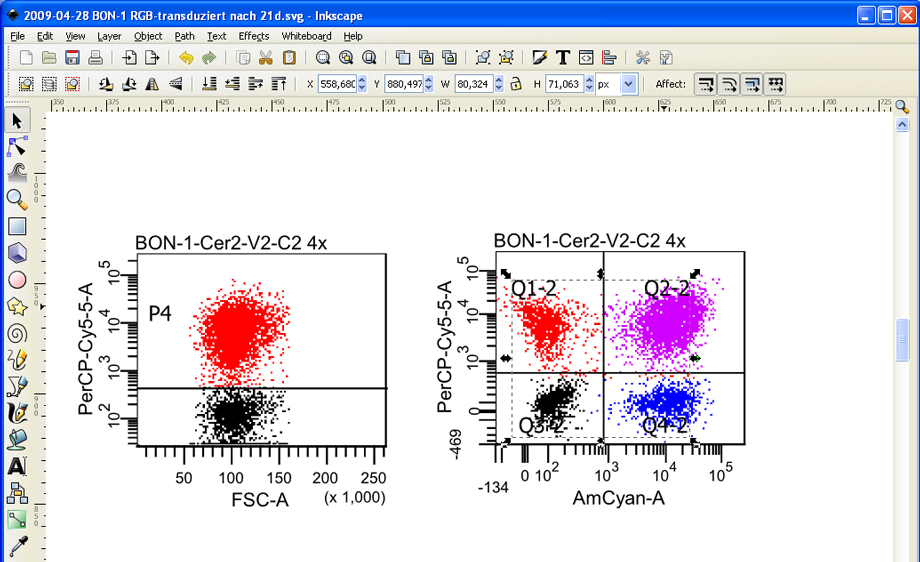
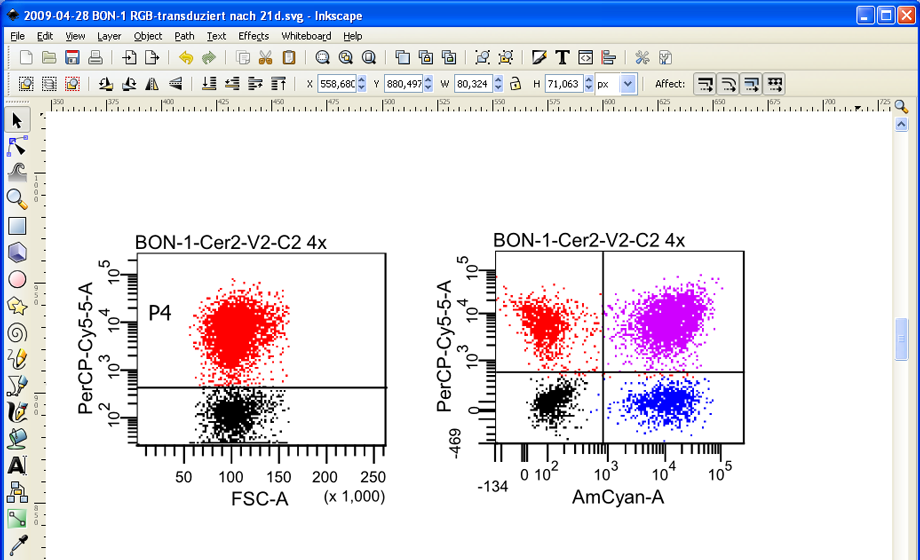
Since Inkscape is able to selectively remove the vector element containing the quadrant labels, it leaves the dots/cells completely untouched.
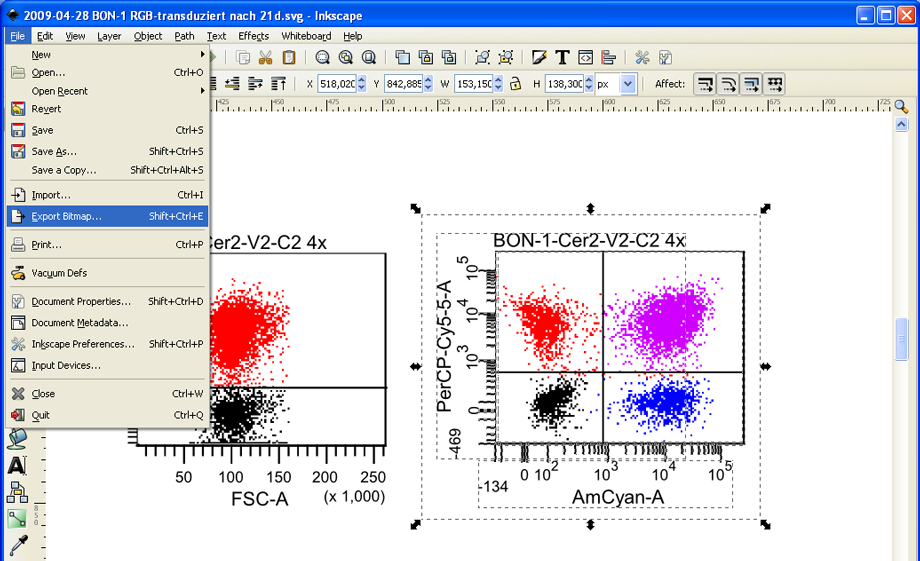
The modified plot can easily be exported as a high-resolution bitmap file. Press and hold down the left mouse button to mark the entire FACS plot. Then click on File --> Export Bitmap.
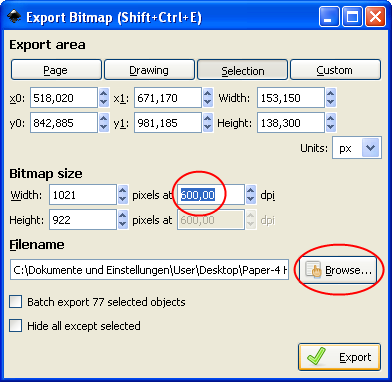
The export dialog automatically is set to Selection – thus the selected plot will be exported exclusively. Also, the desired resolution can be set in the export dialog – 600 dpi (up to 1200 dpi is possible) is a good value (see upper red circle). Now click on Browse to choose a folder where the file should be stored, and click on Export. Inkscape always exports bitmaps as PNG files, which can be easily used in almost any other application (like PowerPoint or Word) or converted to TIFF files without a loss of quality using GIMP.
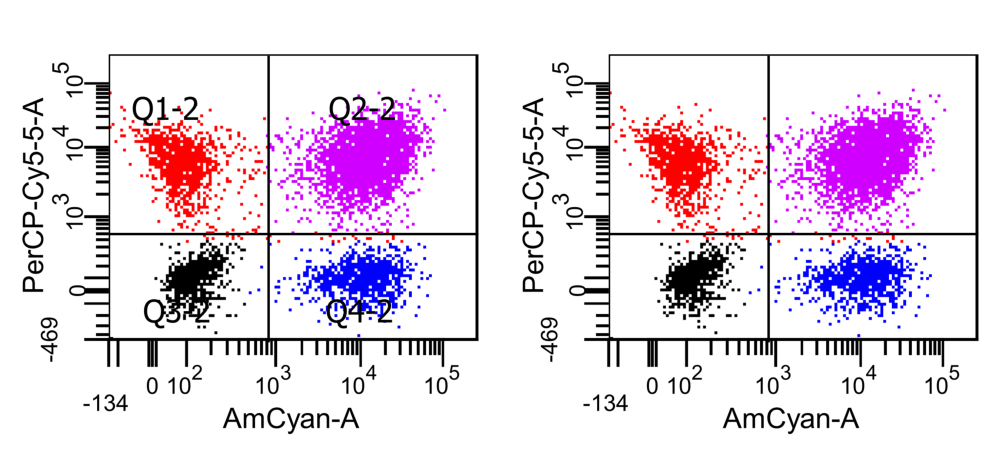
The exported PNG files have a high resolution; the quadrant labels are removed residue-free while the dot plot remains unaltered.
References
Weber K, Bartsch U, Stocking C, Fehse B. A multi-color panel of novel lentiviral "gene ontology" (LeGO) vectors for functional gene analysis. Mol Ther 2008;16, 698–706. [http://www.LentiGO-Vectors.de]
Accepted 03 July 2009
Published 04 August 2009


